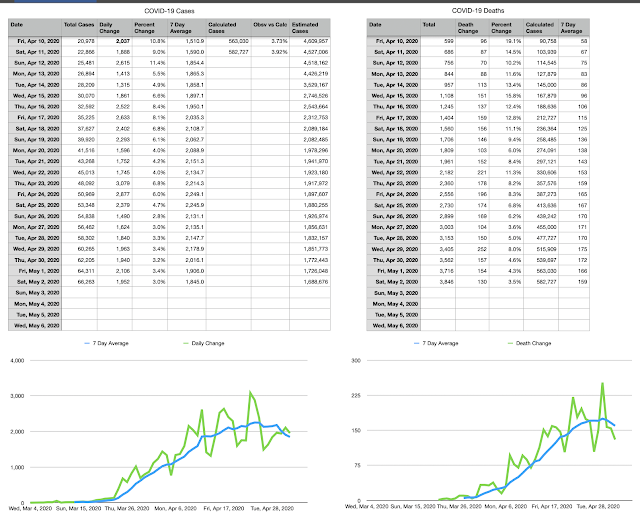
Every day after 4pm I go to the Massachusetts COVID response reporting page and enter the new numbers into a spreadsheet. Initially the data was simple with just new daily cases (remember when they used to say "presumed cases") and no colorful charts so I created my own charts. They now generate a super detailed report daily with charts, testing, breakdown by hospital, etc...
My spreadsheet still has some stuff that they don't provide. First is an average of the daily change for the last seven days which really smooths out the chart and gives a clear picture of the trend. Second is my favorite though because it attempts to back into the number of actual cases based on the total number of deaths. The number of reported cases is problematic because you still have to meet a certain set of criteria in order to be tested. As of 5/2 there were 298,994 tests done in MA, we have about 6.893 million people (that is tests taken not number of people tested).
The Infected Fatality Rate(IFR) for COVID-19 is a controversial subject, it most certainly is not the total deaths divided by the total cases, because that bottom number is missing a bunch of people (MA would have a 16% mortality rate if that were the case). In my models I assume an IFR of 0.66% (I will include calculations for 1% for comparison), which last I checked was somewhere in the middle of the road. So as of May 2 there were 3,846 deaths in MA, which gives us about 582,727 calculated cases (384,600 if using an IFR of 1%). However, since it takes a few weeks for people to pass after catching the virus that is the calculated cases from April 11th. On that day MA reported 22,866 total cases or just 3.92% (5.95% if using an IFR of 1%) of the calculated cases. You read that right the number of cases we saw on the news back on April 11th captured somewhere around 4-5% of the total cases. The good news is that percentage has been consistently rising by about .25% each day. If that trend continues the number of cases reported today 66,293 represents about 9.17% of the total cases (11.17% if using an IFR of 1%) which is a range of 722,000 to 1,688,676 total cases in MA. So 10-24% of the people in the state may have had it. Recent antibody testing in New York and Santa Clara showed very similar numbers.
What does it mean? Damned if I know, but at least it gives me a distraction everyday. #mathiscool#numbersftw
